Weekly Forex Analysis and Trade Setups ; February 13-17, 2017
USD got bullish once President Trump mentioned to announce a major tax plan within coming weeks in a press conference after a meeting with Japanese prime minister.
Upcoming us economic data this week should help Dollar to be stronger. However, Core CPI data would lead the dollar from the next Wednesday.
Let’s look at the trade ideas and their probable setups for this week.
(All charts from FxPro)
EURUSD:
Temper: Bearish
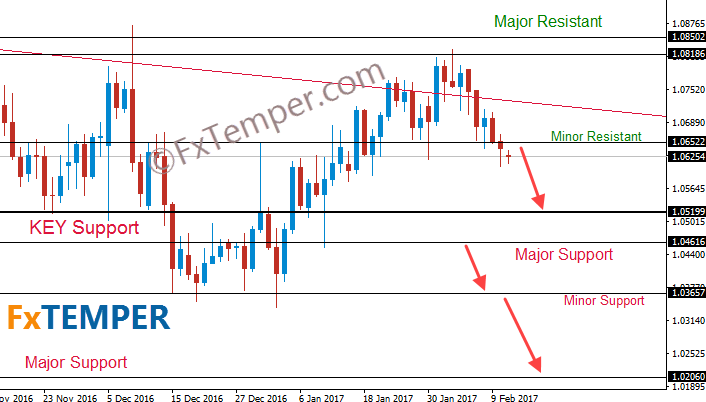
EUR should be weaker ahead of election on EU countries. We had a bearish weekly candle after 7 consecutive bullish weeks. And bearish price action should continue this week.
1.08502 (low of Oct 25,2016) and 1.08186 (low of May27,2015) serving as resistant and 1.06522 (high of Dec30,2016) as support for now.
We have got a bearish closing at last Friday, but I want another bearish closing today (due to gap) to short towards 1.0520.
And a break below 1.04616 would open door to the next minor support 1.03657 (low of December 15)
GBPUSD:
Temper: Bullish
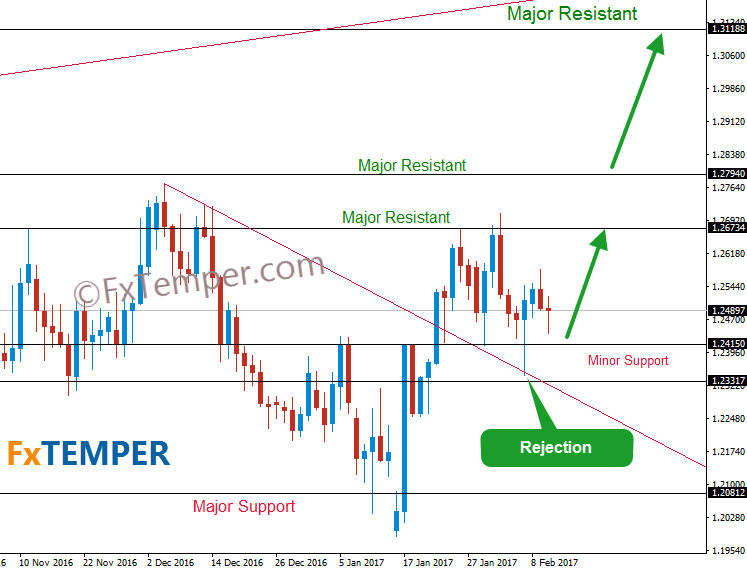
Political uncertainty could raise a chance for second referendum in Scotland, which could be a disaster for GBP.
However, our medium term technical view remains bullish. We’ve seen a rejection candle at February 07 and next Resistant is 1.26734 (high of Nov11).
On the other hand, a break below 1.23317 would create opportunity to short towards 1.20.
EURGBP:
Temper: Bearish
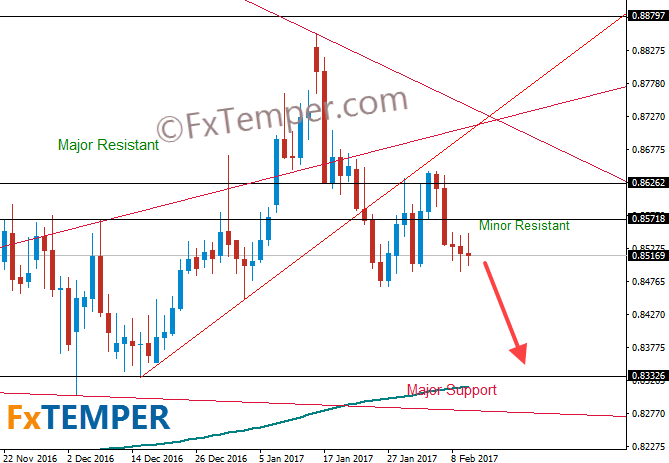
EURGBP should meet the Major support .83326 sooner than later.
A bearish EUR could accelerate that. I am holding short in EURGBP since last week.
GBPJPY:
Temper: Bullish
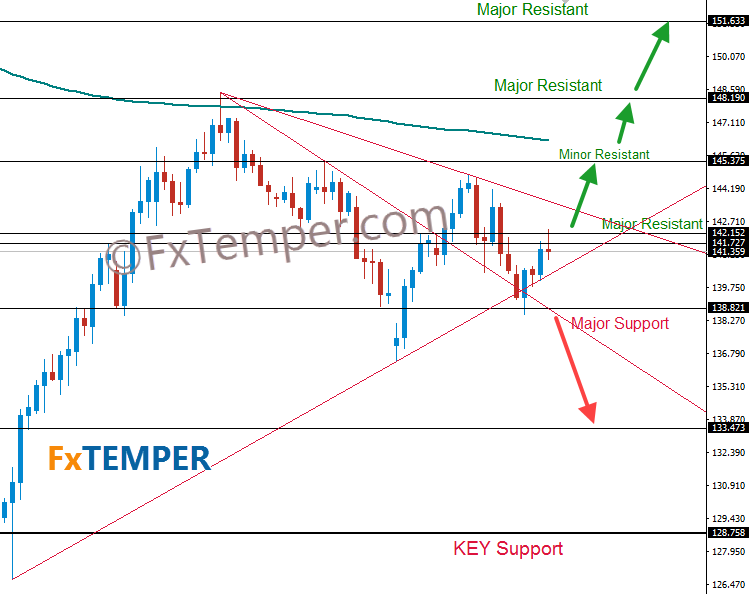
GBPJPY became bullish once ‘Yen’ started to fall at last week.
However, I am waiting to price break the major resistant 142.152 towards another major resistant is 145.375. [mks_highlight color=”rgba(238,238,34,0.9)”]Remember[/mks_highlight] we need 2 consecutive bullish daily candle above the resistant 142.152 to confirm a breakout!
So, we have to wait till daily closing of Tuesday, Feb 14
AUDUSD:
Temper: Bullish
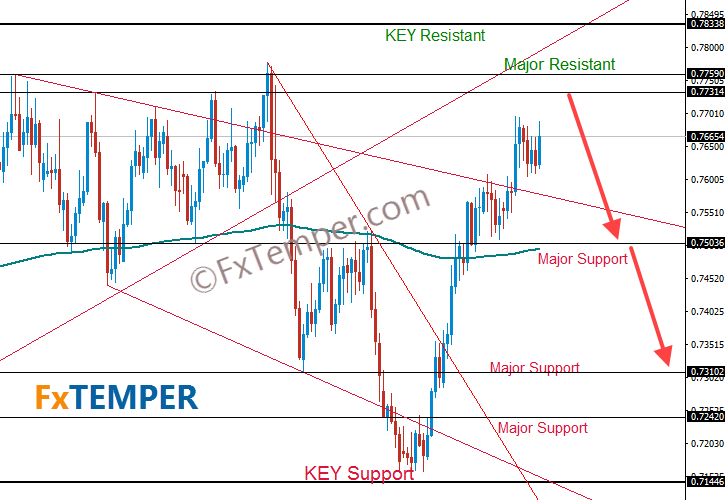
AUDUSD is still bullish and still have a chance to reach .77314/.7759 which are serving as resistant now.
We will be taking short once we get bearish price action signal from the resistant .7759 .
WTI (Oil):
Temper: Neural
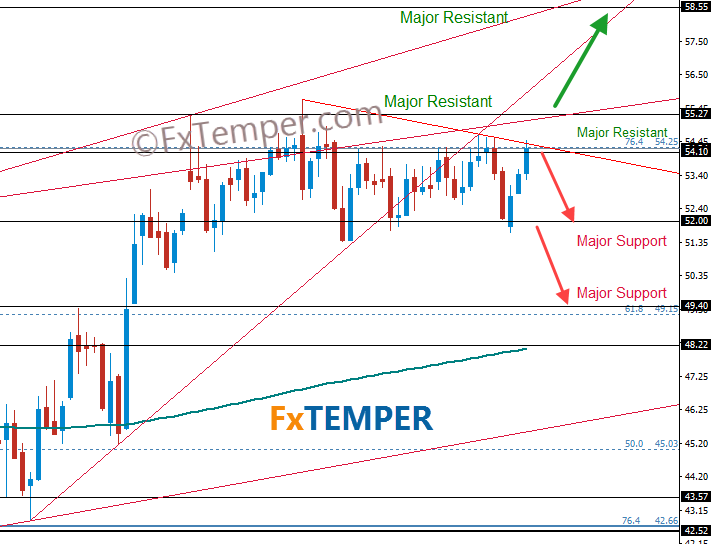
Oil price surge after less production news from an OPEC member.
As I mentioned that WTI must need to break the $52 price to go further down. A fail to break $52 push the price towards resistant $54.10.
WTI closed above the resistant but below the Higher low (low of Nov14 and Nov 29 of 2016) and Higher High (high of Oct 10 and 19 of 2016) trendline. And below a new Lower High trendline.
WTI price is still respecting 76.4% Fibo retracement level.
A breakout of major resistant $55.27 (high of Dec 12,2016) would open door towards next resistant $58.55
Stay cautious, Don’t short unless a breakout of $54.10 by double daily bearish candle. So, wait till the daily closing of next Tuesday.
Do you want more analysis? USDJPY, EURJPY, USDCHF, GBPCHF, NZDUSD, EURNZD, GBPNZD, USDCAD, Gold, Silver, SPX500, UK100, Nikkei225 and more. Get them at premium membership area.