- Our analysis is Free but a micro-donation will inspire us more
- BTC Wallet: 16qTipR2Fv3xdE2Z8V9VCmbZbTs4SYGFTy
- ETH/PAX/ERC20 token: 0x3F10a626468F6D2bB91AA639B89f9087b45169Db
Bitcoin bull finally taking charge after more than a year of a bearish market. But with this bull price action, one question is getting more attention which is ‘Is it going to last’?
To find the answer to that we have to discuss both sides of the probability. Bitcoin did something phenomenal last week. The price of Bitcoin declined 50 EMA (on the weekly chart) almost immediately in the past when there was a bear market except for this time its pushed through it and closed above!
But it doesn’t necessarily indicate a confirm bullish breakout, the price still can come down this week. False breakout like this happens so often. A false bearish breakout attempted at March 2018, then another false bull breakout attempted in July 2018. This is the 3rd time it’s trying to break within a year and last two was a fake breakout. It could easily reject $6k zone next week. So, we have no choice but wait this week to confirm a breakout. Check here the chart
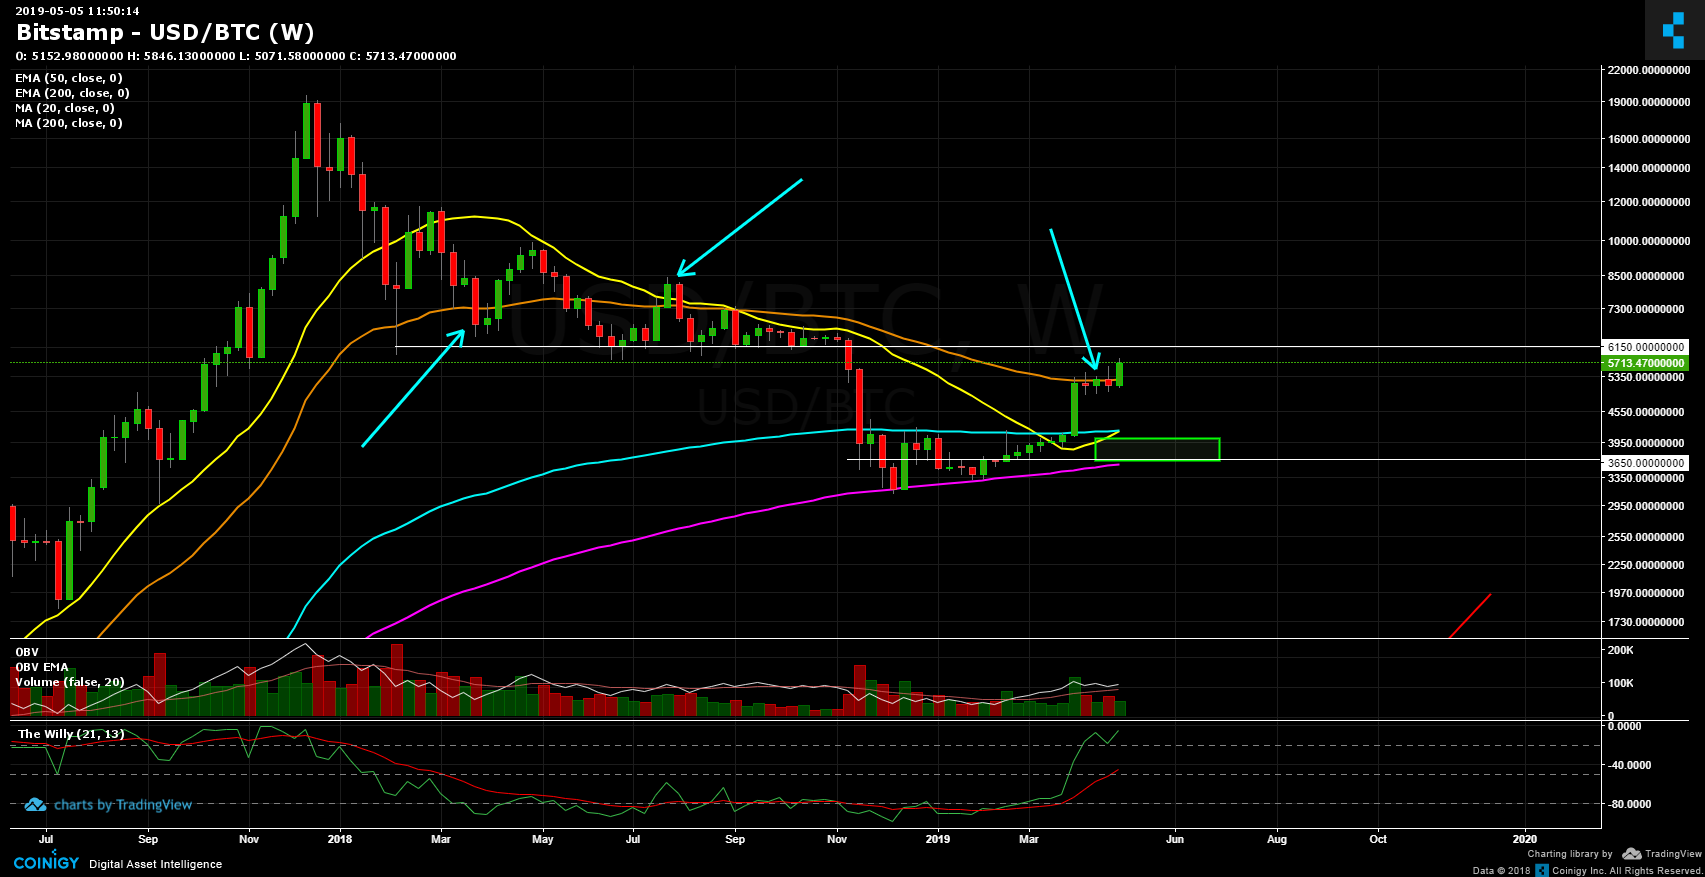
On the other hand, the 200 simple moving average of a 3days chart lies at $7000 zone and for the first time after March 2018, we are having a 21 & 50 ema crossover in 3 days chart. Which tells you bull is going to take control in upcoming days. And our Momentum indicators (Willy, find blue arrow) says it’s still above the 13 Ema and remaining in the bullish zone.
Don’t underestimate the power of a trending market, Price won’t move other direction just because it raised a lot. There is no sign of a bear market in the Daily chart yet, actually, it’s having a super bullish ‘Golden Cross’. The market is bullish without a doubt until it holds above 21 EMA, I will wait until it closed below 21 moving average or close above $6000. Round number $6000 price zone is very important for Bitcoin, It has a higher chance of reaching 6450 if breaks above $6k.
However, $6000 was previous support and We expect it to hold as resistance to consider the overall market as bearish. With the present market momentum it would be really tough for the bull to cross $6000 and hold it, bearish divergence on Daily RSI is already in place but normal in 4 hourly chart (left) it’s still normal.
So, best practice would be waiting and see which way the market leads. We will update the analysis as soon as there is something happening so keep following us.