Dollar index finished a bullish week and closed above the resistant 100.65, However, the greenback is falling against other safe haven currency Yen and yellow metal gold. The US surprise airstrike against Syrian government carrying a whole new level of risk appetite among the traders.
US sent an aircraft carrier and warships to Korean sea, so do Russia to Syria. We are about to face a whole new policy by Trump administration. We are expecting a clear direction from chair Janet Yellen on Monday.
Let’s look at the trade ideas and their probable setups for this week.
(All charts from FxPro, you should update according to your broker)
EURUSD:
Temper: Bearish
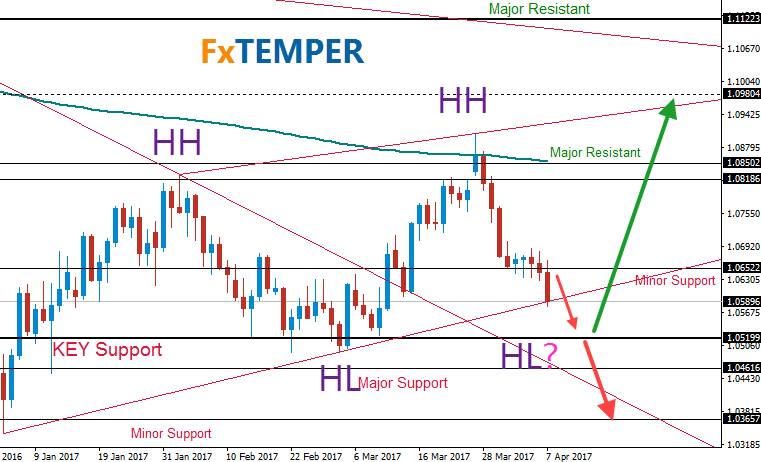
Upcoming French election is the center of EUR right now. Extreme nationalism is raising on Europe and a victory of Le Pen could damage the EUR at least 10 percent as she promised a Frexit. EUR carrying a significant risk ahead of the election.
We doubt any rate hike from ECB sooner as their second largest trading partner leaving. We believe the hawkish tone is just a figure of speech. They will wait to get a hit from politicians.
The price is currently below a minor resistant 1.0652 and its need to find a support for now. The key support of 1.0520 would be perfect for it.
However, EURUSD maintaining an uptrend since the January 2017. And a bullish price from this higher low trendline is unlikely possible.
So, we will wait and see how price reacts with the trendline. We will be only shorting if the price action break below the Key Support 1.0520 in coming days.
On the other hand, a break above 1.0652 could open the door towards 1.0980 area.
GBPUSD:
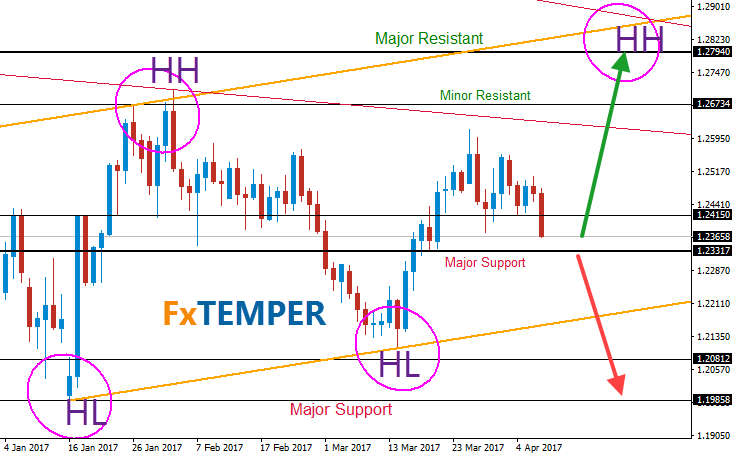
Temper: Bullish
GBP is the most undervalued currency. Times are just against it. The fate of GBPUSD is depended on how the both party (UK & EU) handle the negotiations.
The anti-uk sentiment is growing in Scotland. A second independence referendum unlikely be against the pound unless UK offer them something better. Any possibility of a separation between UK and Scotland would be the last nail in the coffin of the pound.
GBPUSD is facing the most significant major support 1.23317 now. A break below of this price pound is bearish and above this price pound is bullish.
A point worth watching that there still a half-way chance of an ascending channel in the daily chart. And a falling wage is forming in H4 (check it in the premium section)
Our short-term outlook for cable is still bullish towards next major resistant 1.2794. There is a minor resistant at 1.2415, we want a bullish closing above that price to hold any long position.
1.1985 will act as Key support if its break below of 1.23317. And below 1.1985 is an unknown territory. We are not expecting something like that for now.
EURGBP:
Temper: Bearish
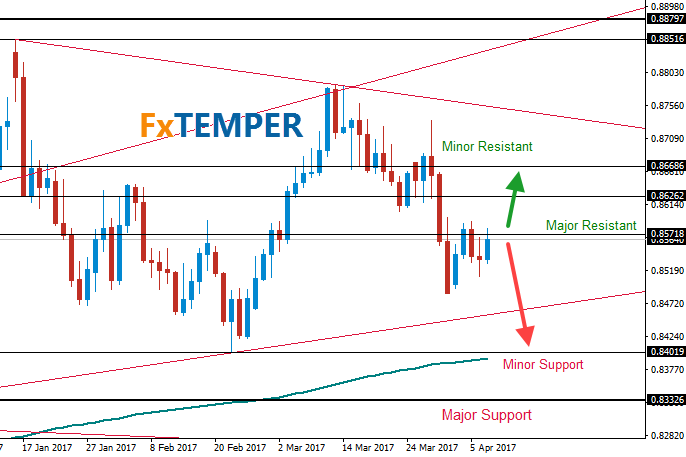
Our view remains same with EURGBP. Price re-test the immediate major resistant .85718 and respecting it.
Next move should be downwards to the higher low trendline (December and February low) or perhaps the full target .8402.
AUDUSD:
Temper: Bearish

AUDUSD is my most favorite pair through the first quarter of 2017 as we have seen some significant price action move. Our short hit TP in 3 days only!
Last week price closed below the most important major support .75036 but we have to watch the daily closing of Monday as well below this price (low of march 09 would be more appropriate).
A break below the .75036 would open the door towards another major support .7310 with a minor support at .7369 (not need to respect much, but we will close some position there).
On the other hand, a close above .75036 today would be a fake-out and we will wait for another daily closing. You can check my twitter feed for the latest update.
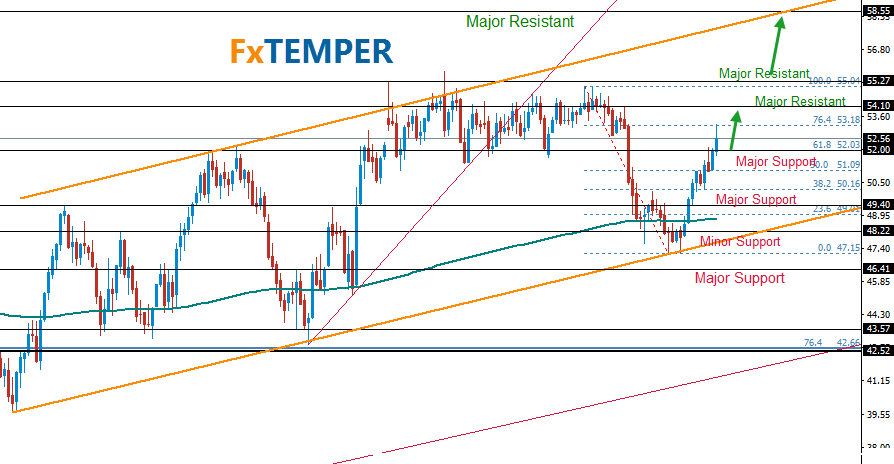
WTI (Oil):
Temper: Bullish
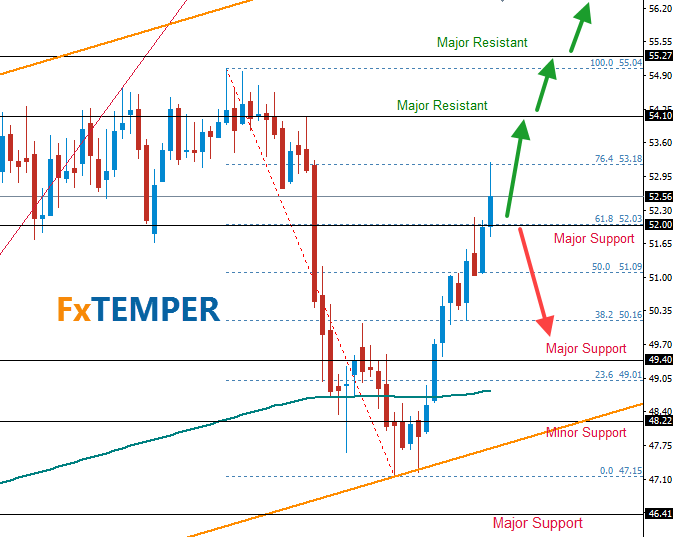
Oil is having the most bullish momentum for now as a new war game going on in the middle east. Our long position hit TP last week. And we are running another long position towards $54.10. Next Tuesday has the most chance to hit TP.
WTI could raise as high as $58 in coming weeks. But before that, we expect to break $55.27 (high of December 12, 2016) first! Check the full chart and projection below.
Do you want more analysis? USDJPY, EURJPY, GBPJPY, USDCHF, GBPCHF, NZDUSD, EURNZD, GBPNZD, USDCAD, Gold, Silver, SPX500, UK100, Nikkei225 and more. Get them at premium membership area.